kaptn
v2.0.1
Unlock the full power of the kubernetes command kubectl, while easily initializing and monitoring kubernetes clusters
Download Now


FEATURING:
KAPTN KRANE -
NEW!
View live metrics and historical graphs, scale, delete/restart, and rollout resources like pods, nodes, and deployments in our intuitive, easy-to-use interface that harnesses the power of kubectl commands.
Featuring custom speedometer-style gauges, filtering by namespace, sorting by CPU and memory percent, and much more, taking command of Kubernetes is now easier than ever!
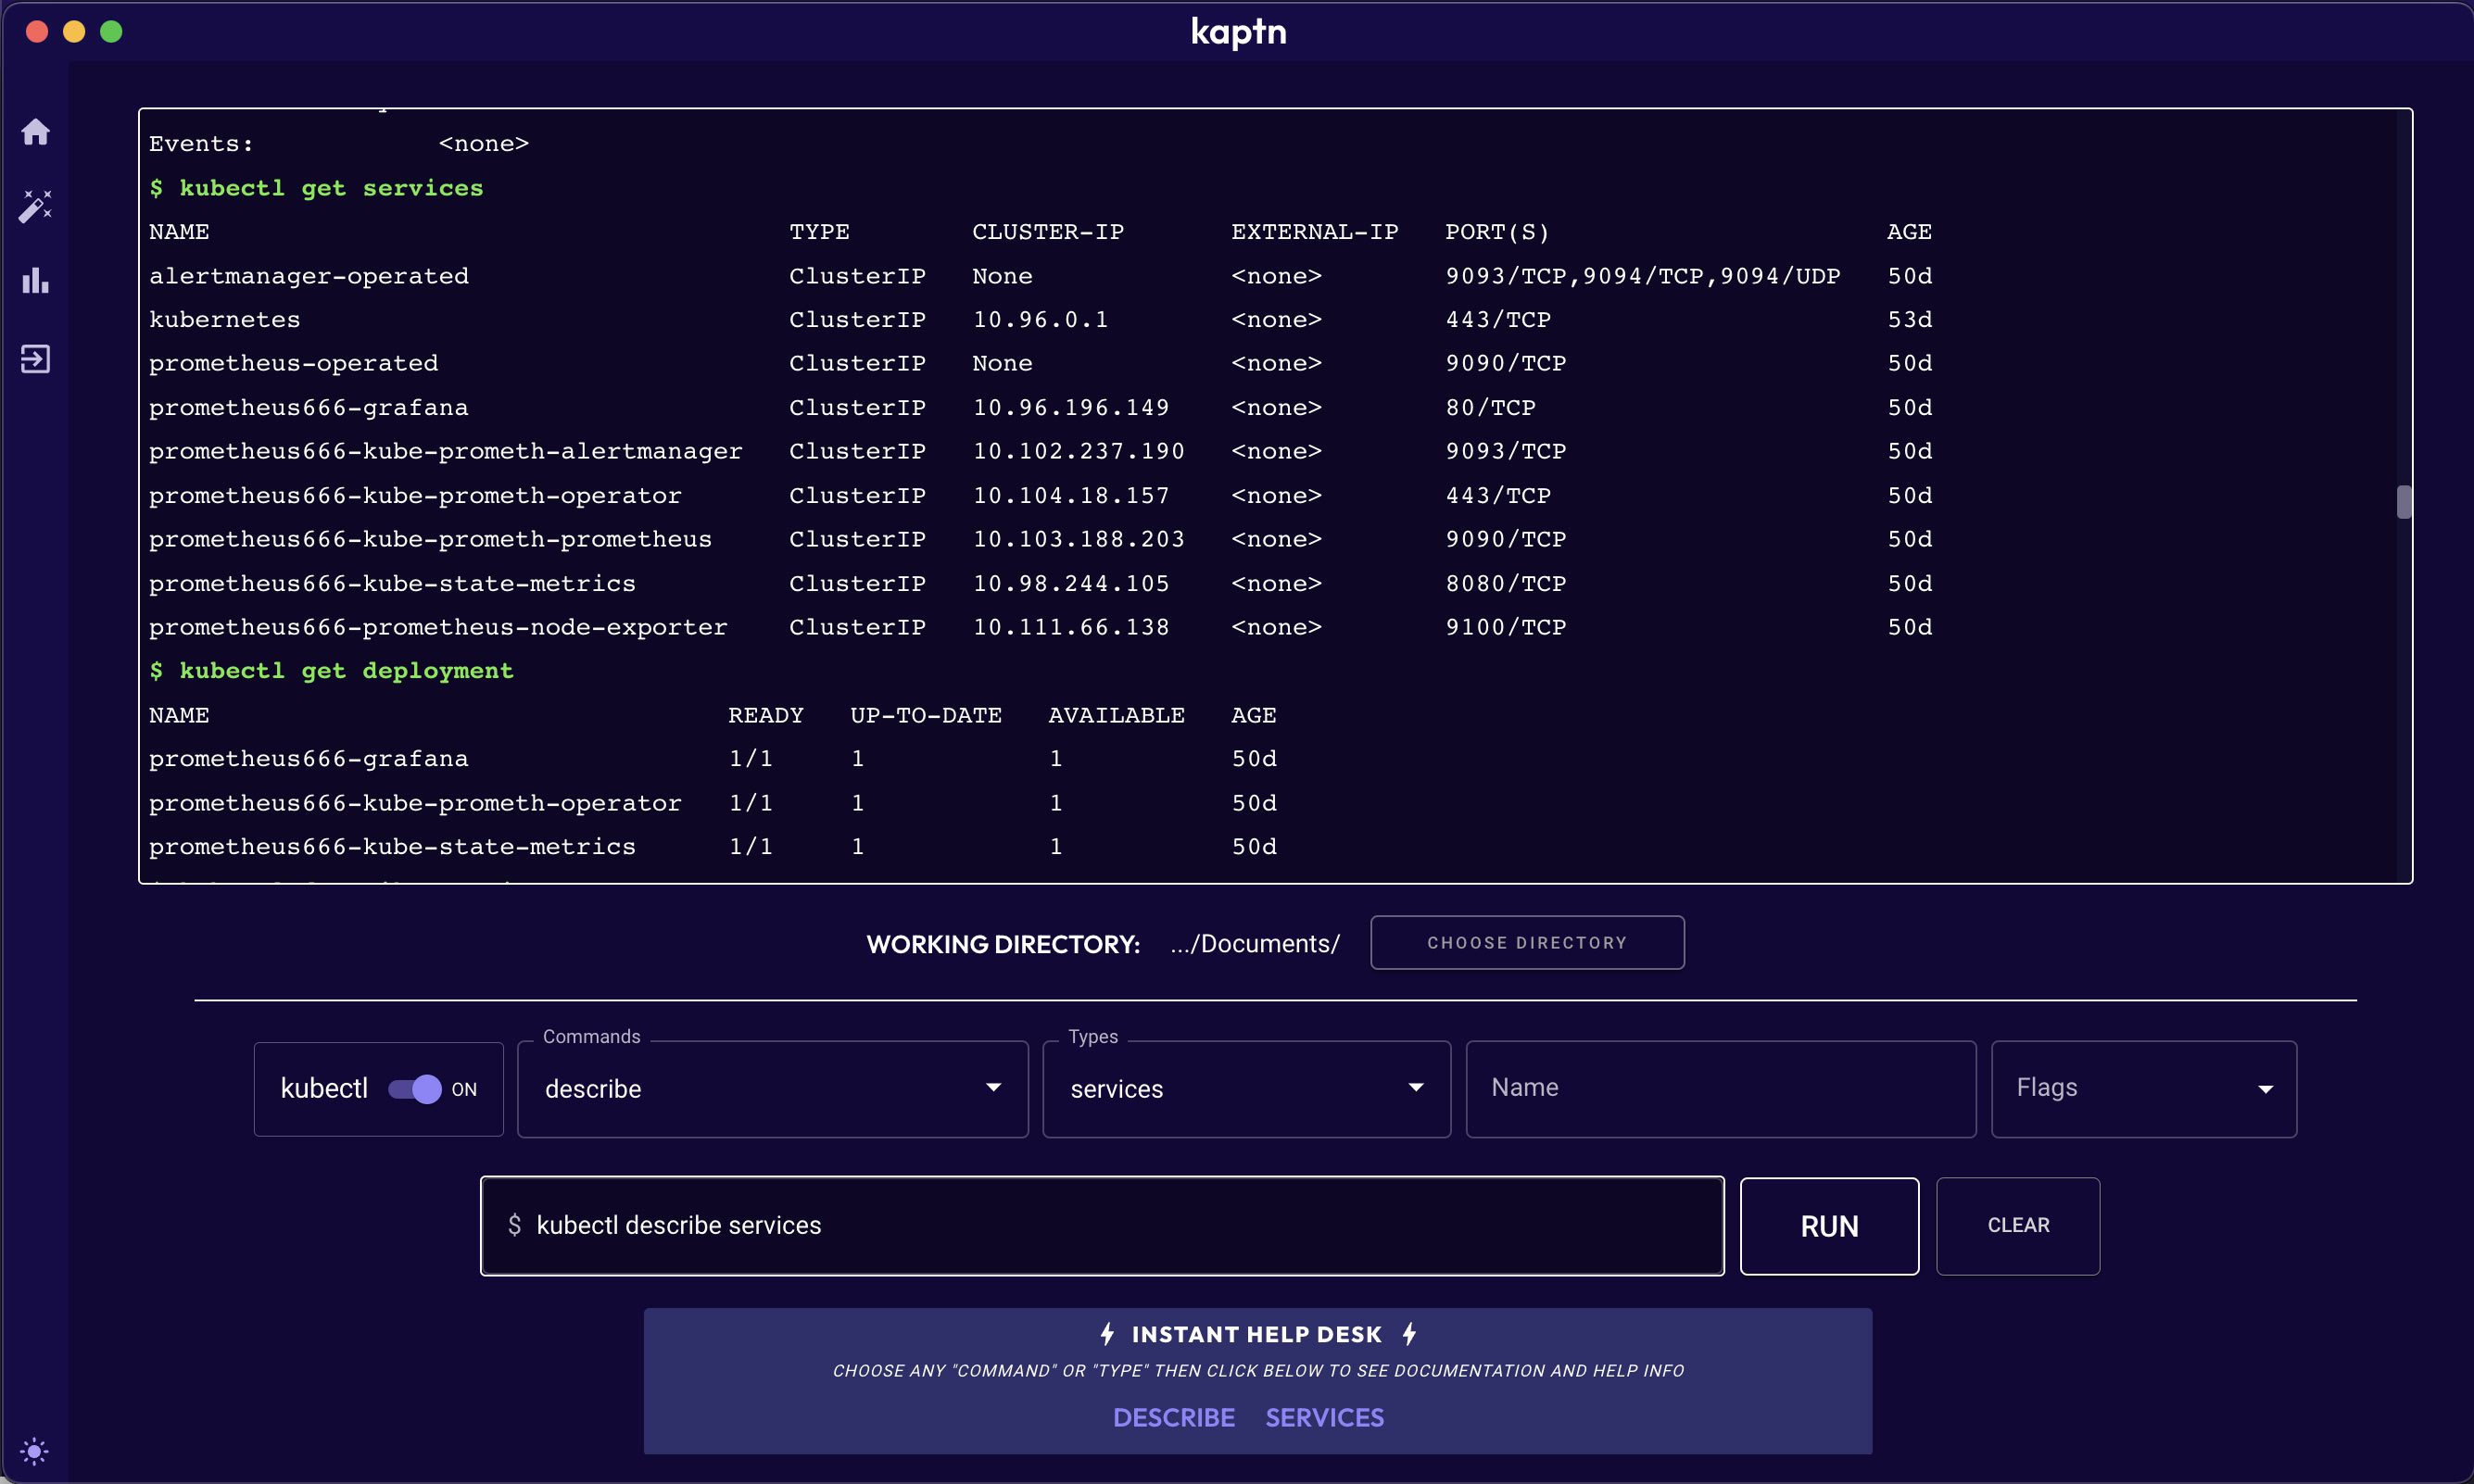
USER-FRIENDLY TERMINAL INTERFACE
Take command of the command line interface with our pre-configured kubectl options, or free type commands into our CLI.
Clearly visualize your commands within our interactive terminal, and take advantage of the improved readability.
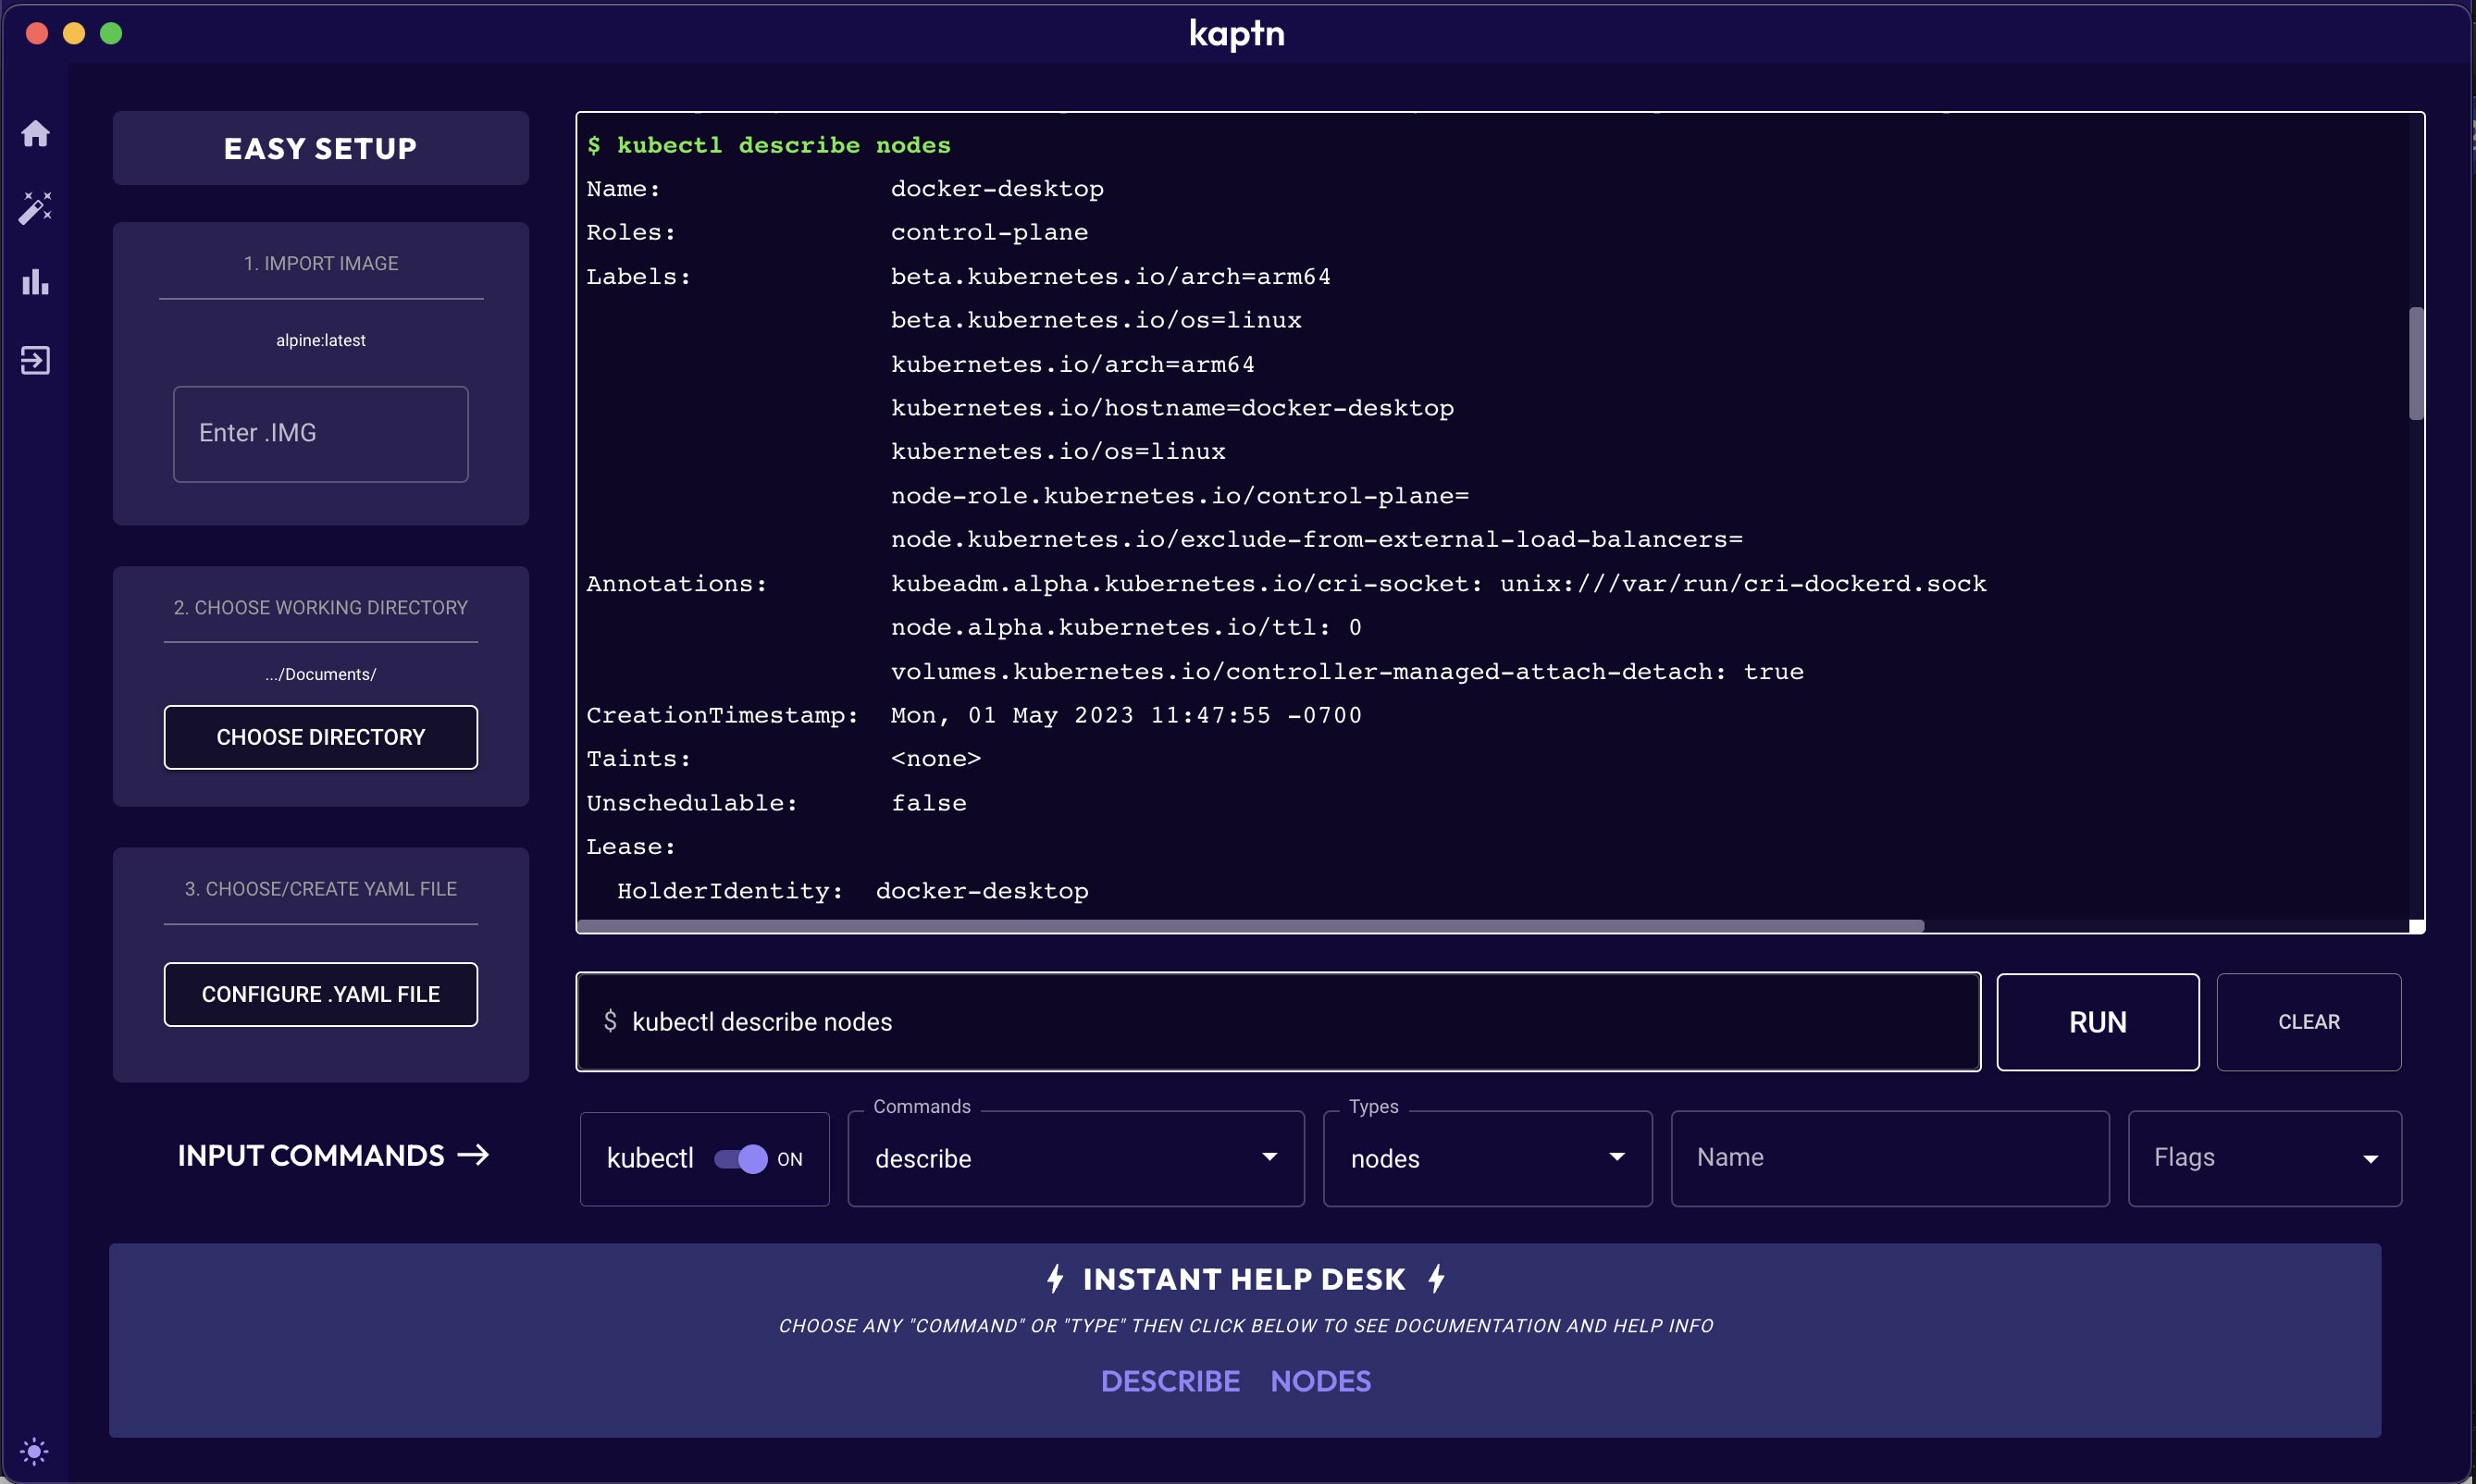
QUICK KUBERNETES SETUP
Kickstart your project by creating your own docker image or uploading an image using our easy setup configuration.
Generate a custom YAML file personalized to your projects' needs using a pre-configured template, allowing you to shorten tedious setup time and start working with your clusters.
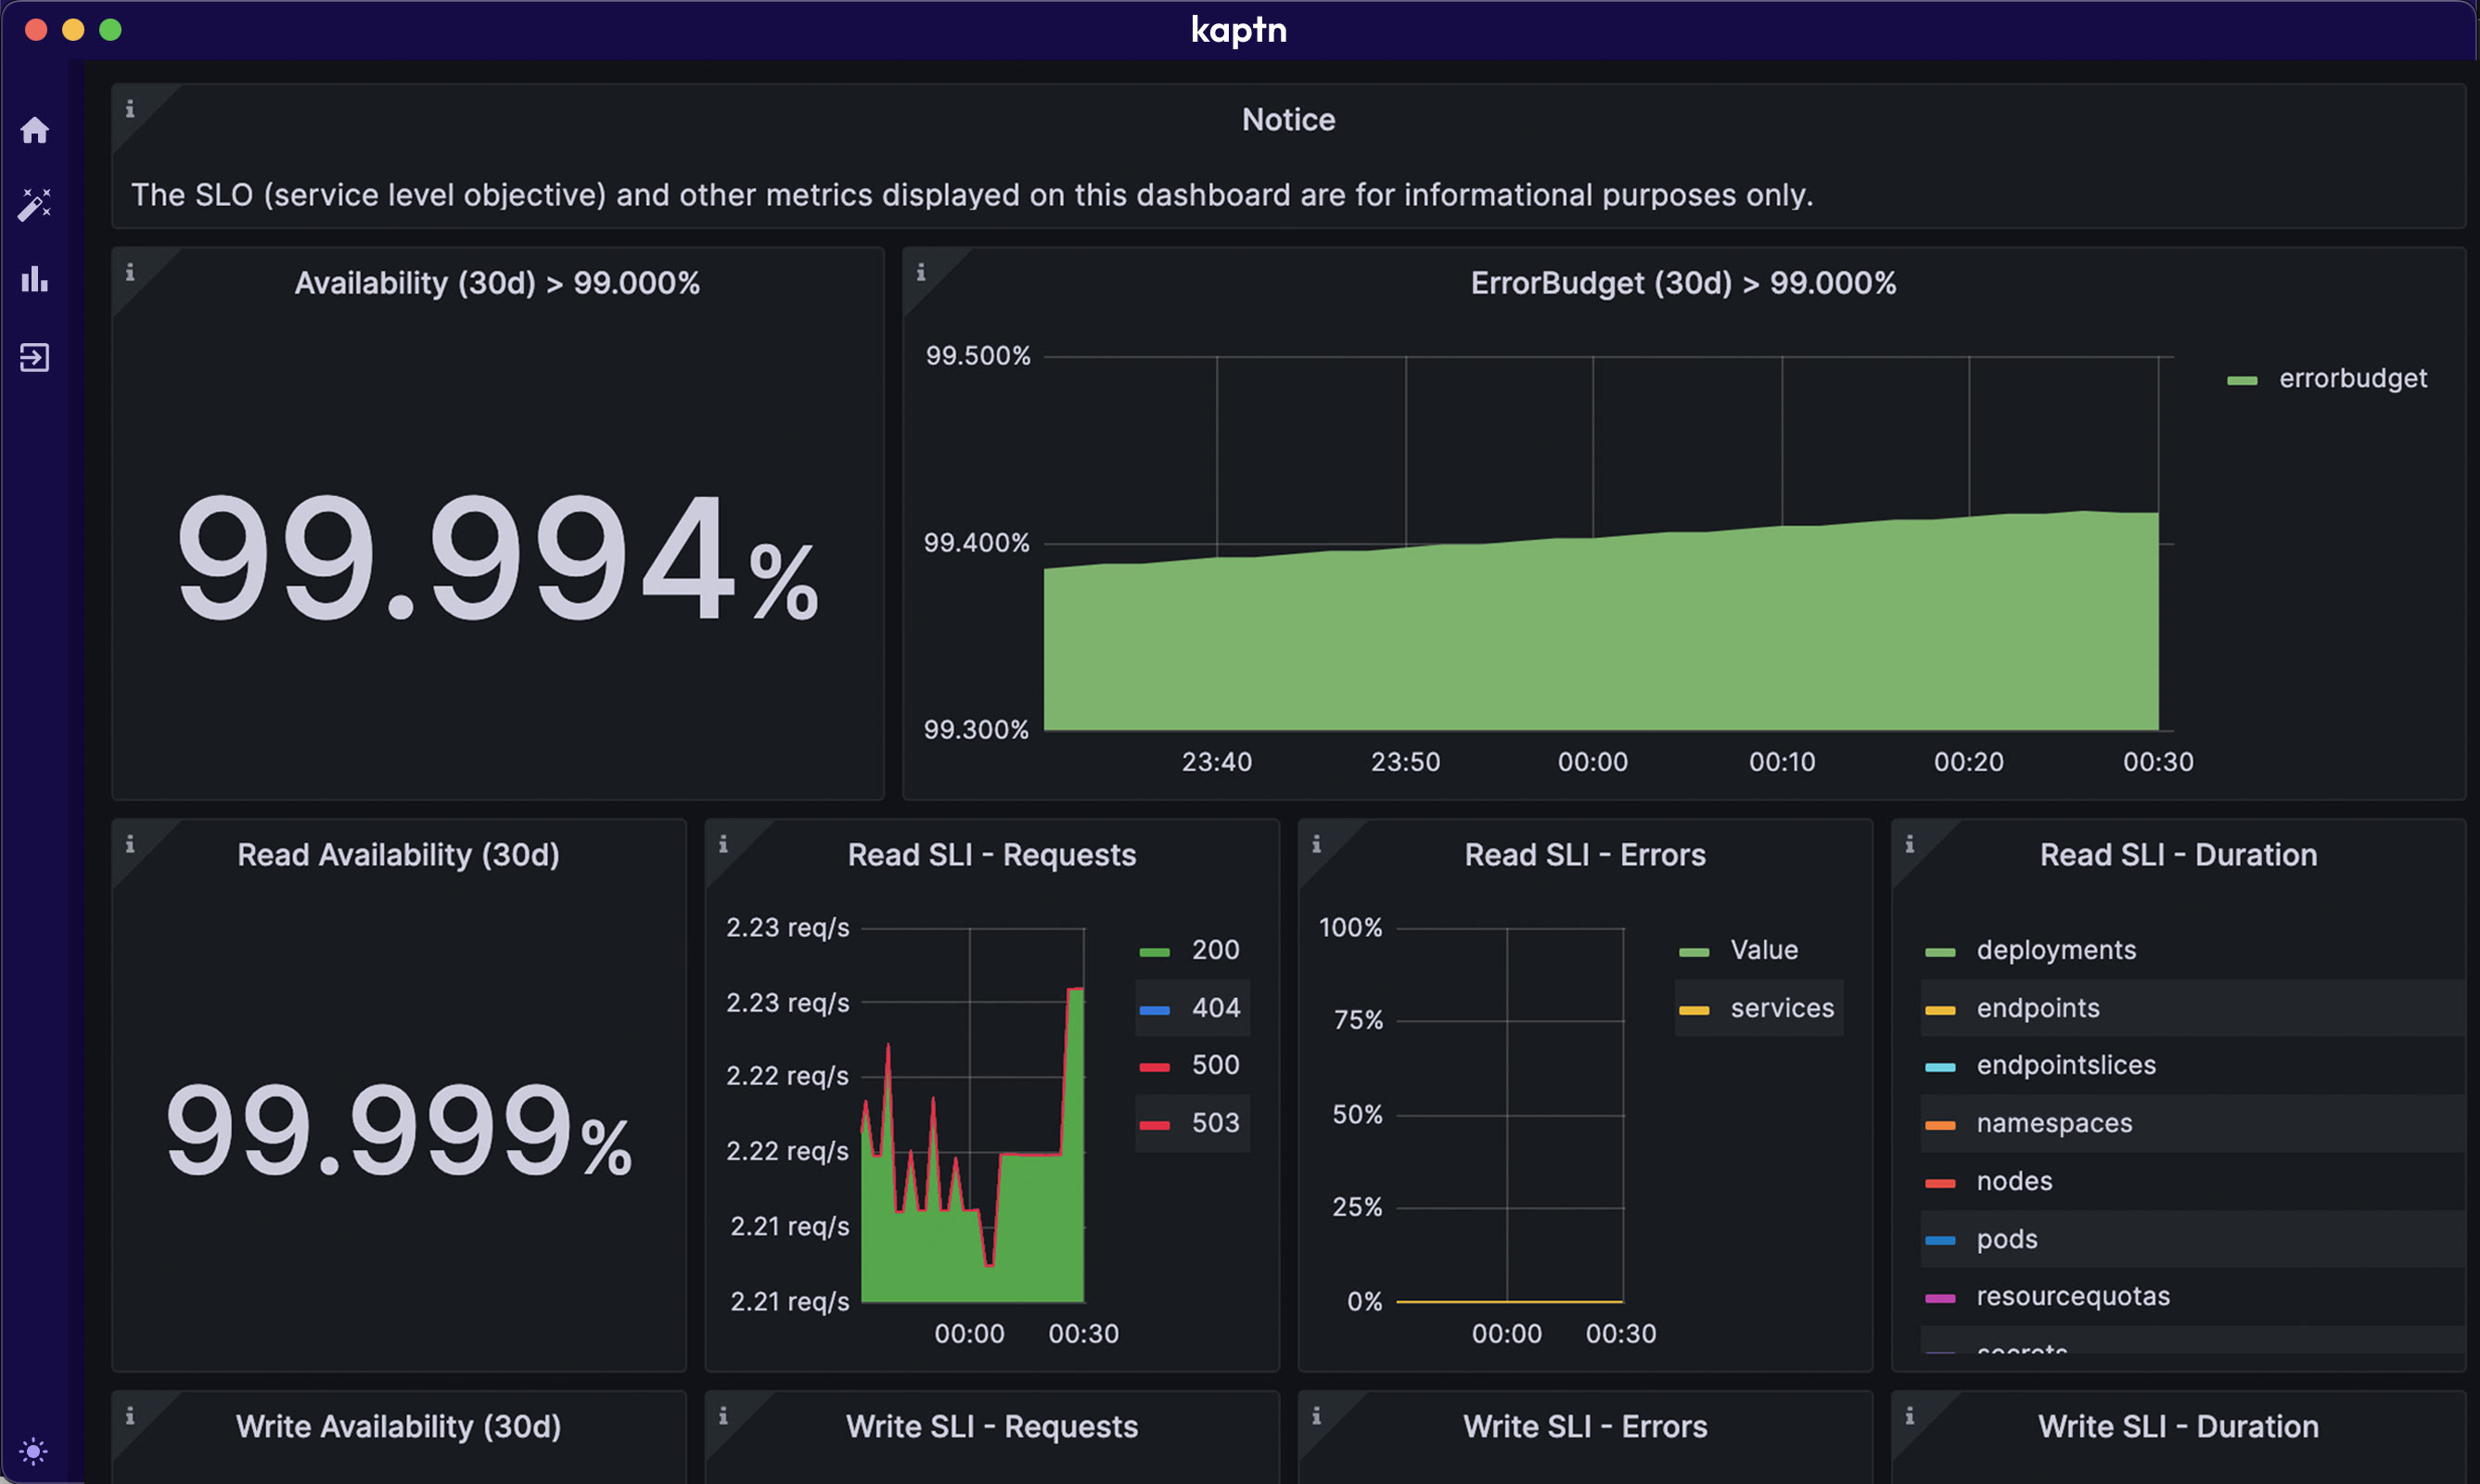
CLUSTER METRICS VISUALIZATION
Easily sync your kaptn workspace to Grafana and Prometheus to allow for clear and real-time visualization of your clusters' health.
Utilize our quick set up if you are not already connected, and consider kaptn your only stop for working with and monitoring your kubernetes clusters.
HELP & LEARNING RESOURCES
Kubernetes can be difficult to learn, let alone master. So we've created special tools to aid those new to using the technology.
Now you can get help information about any command or type at the click of a button with the Instant Help Desk, or you can follow tutorials and master Kubernetes with the Learning Center.
LIGHT MODE / DARK MODE
Whether it's eye strain, or just personal preference, we know engineers can be selective about their work environments.
So we created a Light/Dark mode that allows you to work with your favorite color combination. Now you can focus on coding with no distractions to your workflow.
Read Our Press


Meet Our Engineering Team

Brecht Horn
Software Engineer


Hwi Won (John) Choi
Software Engineer

Natalie Cordoves
Software Engineer

Olivia Hodel
Software Engineer

Yining Wang
Software Engineer